Financial Review
Download Financial Review (392KB).
Highlights
Group revenue for the year improved 21.3% or $206.8 million to $1,176.8 million. Food Solutions and Gateway Services both registered annual increase in revenue by $67.1 million or 11.7% and $142.8 million or 36.6% respectively, largely contributed by the continued recovery of the aviation sector as border restrictions eased.
Operating loss for the Group increased by $32.5 million from last financial year’s loss of $10.1 million to $42.6 million in FY2021-22 mainly due to lower government grants and higher costs.
Profit contribution from associates/joint ventures grew by $65.1 million to a profit of $17.1 million, compared to a loss of $48 million in the last financial year. The stronger performance of the associates and joint ventures was attributable to the improvement in the aviation sector as borders continue to reopen.
The non-operating gain of $12.2 million recorded in FY2021-22 was related to the accounting gain of $28.9 million which resulted from the revaluation of an associate, Asia Airfreight Terminal Co. Ltd. (“AAT”), following the Group’s purchase of additional and controlling stake in AAT as at 31 March 2022. This gain was partly offset by impairment of property, plant and equipment in the financial year.
Group net profit attributable to owners of the Company (“PATMI”) improved $99.3 million to a net profit of $20.4 million year-on-year. Excluding one-off items, core PATMI was reduced to a net loss of $8.5 million, showing an improvement of $15.4 million compared to the higher net loss of $23.9 million in the last financial year. Without government reliefs, Group PATMI would have been a loss of $112.2 million, a marked improvement from the loss of $320.8 million in the last financial year.
Return on equity improved 6.3 percentage points to a positive 1.3% from a negative 5.0% in the last financial year as the Group reported a higher net profit for the year.
As at 31 March 2022, the Group’s total assets were $3,292.3 million with cash and short-term deposits amounting to $786.0 million while free cash flow is at negative $15.6 million. Debt-to-equity ratio improved to 0.46 times compared to 0.51 times a year ago.
.png?sfvrsn=eb774eb1_0)
Earnings Per Share
The Group’s earnings per share was 1.8 cents in FY2021-22, 8.9 cents higher than the negative 7.1 cents in the past financial year.
.png?sfvrsn=5faee603_0)
Dividends
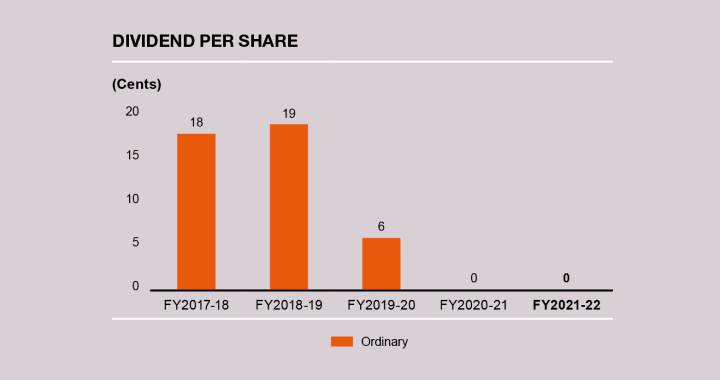
In light of the economic uncertainties caused by the COVID-19 pandemic and its lingering effects on the recovery path of the aviation sector, the Board of Directors has proposed to the general meeting that no dividends be paid for FY2021-22 until the situation stabilises.

Revenue - By Business, Industry and Geographical Location
.png?sfvrsn=4ac0c29f_0)
Combined Revenue By Geographical Locations
The Group’s combined revenue improved significantly by 20.9% year-on-year with growth in all regions. Overseas contribution to the Group combined revenue increased year-on-year from 32% to 34% in this financial year.
.png?sfvrsn=f2ff0747_0)
Expenditure
The Group’s operating expenditure of $1,219.4 million increased by $239.3 million or 24.4% year-on-year with increase in staff costs, raw materials and other operating expenses as business volumes increased and government reliefs reduced. Staff costs were driven up by $168.3 million mainly due to increase in headcount and contract labour as well as tapering government reliefs as the business ramped up along with the aviation recovery. The cost of raw materials rose in line with higher aviation volumes and supply chain disruptions arising from COVID-19. Higher other operating expenses were resultant from higher fuel costs and lower government grants, partly offset by lower provision for doubtful debts during the year. Licence fees dropped $3.6 million despite higher aviation revenue due to adjustments for rebates.
.png?sfvrsn=491ec7d3_0)
Financial Position
Total equity attributable to the owners of the Company increased $56.3 million or 3.6% to $1,602.6 million as at 31 March 2022. Total equity of the Group increased $134.9 million or 7.9% to $1,833.7 million as at 31 March 2022. The higher equity was attributed to the profit generated in the financial year of $4.3 million, foreign currency translation gains on top of higher non-controlling interest due to consolidation of SATS Food Solutions (Thailand) Co., Ltd. (“SFST”) in July 2021 and AAT in March 2022.
Total assets increased $200.5 million to $3,292.3 million. Non-current assets increased $227.2 million mainly due to higher property, plant and equipment, right-of-use (“ROU”) assets, intangible assets, and deferred tax assets which were partially offset by lower investment in associates. The increase in property, plant and equipment, ROU assets and intangible assets were mainly attributable to the consolidation of SFST and AAT. The lower investment in associates was mainly due to dividends received during the year as well as the transfer of investment in AAT from associate to subsidiary.
Current assets of the Group decreased $26.7 million largely due to lower cash and short-term deposits and inventories, partly offset by higher trade and other receivables. The lower cash and short-term deposits are largely due to the repayment of term loans offset by the net cash from the acquisition of new subsidiaries.
Capital expenditure of $79.2 million was $16.6 million or 26.5% higher compared to last year. The Group’s net asset value per share as at end of current financial year was $142.8, 3.4% higher compared to last year.
.png?sfvrsn=39a781a7_0)
The Group’s cash and cash equivalents was $786.0 million as at 31 March 2022, a decrease of $93.8 million attributed to the repayment of a term loan ahead of its maturity, partly offset by the net cash from the newly acquired subsidiaries during the year.
Net cash from operating activities was $62.3 million, $55.4 million lower than the last corresponding period mainly due to lower grant receipt partially offset by the improved business performance as seen in higher EBITDA excluding government grant.
Net cash from investing activities was $31.1 million, $59.4 million higher than the last corresponding period mainly due to the consolidation of the cash of SFST and AAT, offset by the payment made for the acquisition and higher capital expenditure.
Net cash used in financing activities was $189.3 million in this financial year, compared to an inflow of $239.5 million last year, largely due to the payment of $150 million term loan ahead of its maturity whilst last year’s cash inflows was mainly due to the drawdown of credit facilities.
Free cash flow for the year was an outflow of $15.6 million, a drop of $71.8 million compared to the inflow of $56.2 million generated last year.
.png?sfvrsn=5d31d370_0)
Value Added
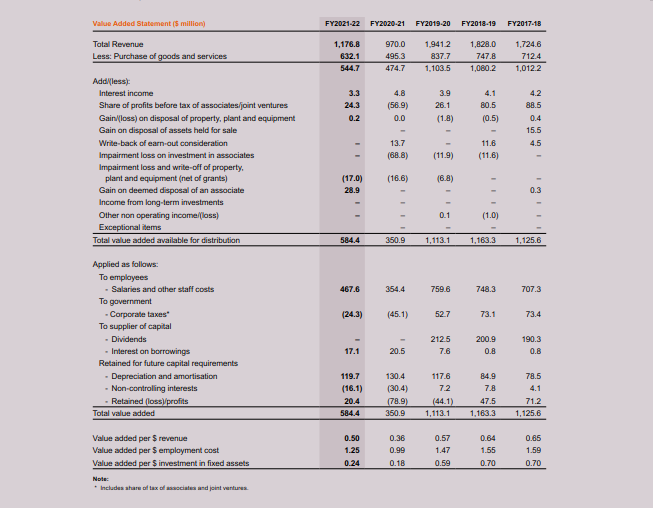
The value added of the Group was $584.4 million, an increase of $233.5 million or 66.5% compared to the preceding financial year. The distribution for FY2021-22 is reflected in the chart below.

Staff Strength and Productivity
The average number of full-time equivalent employees in the Group for current financial year was 11,345. The 12.5% decrease was due to continued cost management focus and initiatives to navigate through the gradual aviation recovery across our regional network.
The breakdown of the average number of employees is set out as follows:
.png?sfvrsn=6a0a303d_0)
Staff productivity achieved during the year, measured by value added per employment cost, increased 26.3% from 0.99 times to 1.25 times. The higher revenue and contributions from associates/joint ventures as well as lower one-off impairments and gains have led to the improved staff productivity.

.png?sfvrsn=33f0745f_0)
.png?sfvrsn=ca710078_0)
Economic Value Added (EVA)
EVA for the Group was a negative $174.2 million, an improvement of $11.2 million over the preceding financial year attributed to higher net operating profit after tax (NOPAT).
