Financial Review
Download Financial Review (184KB).
Highlights
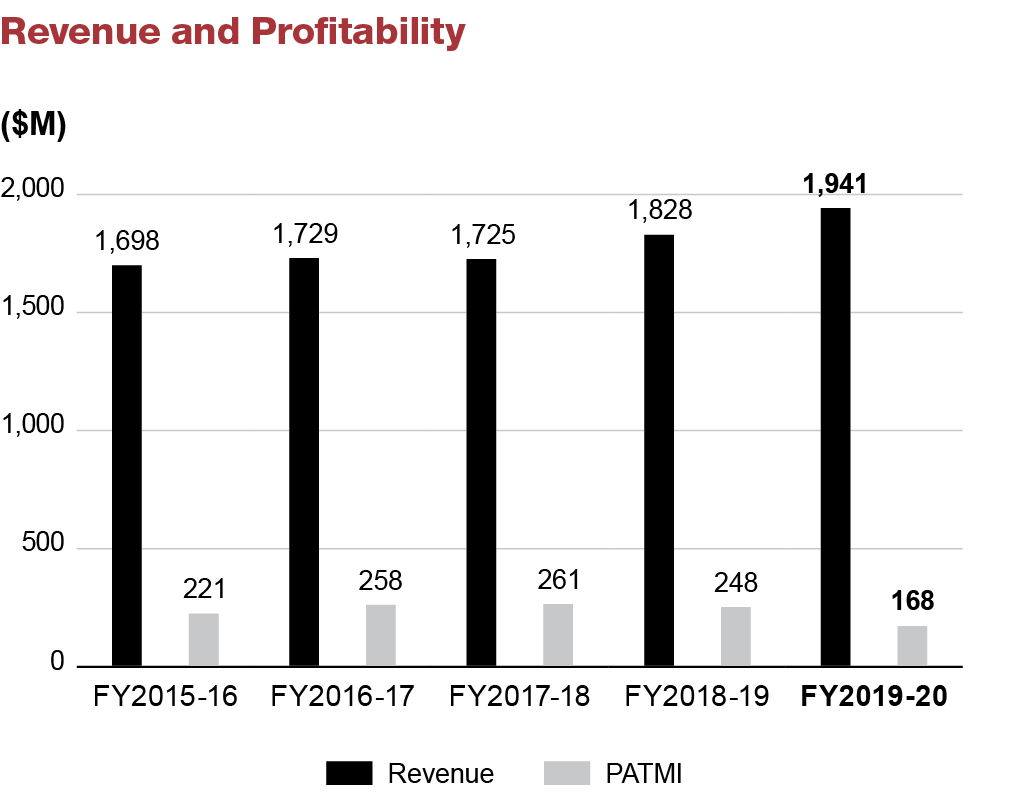
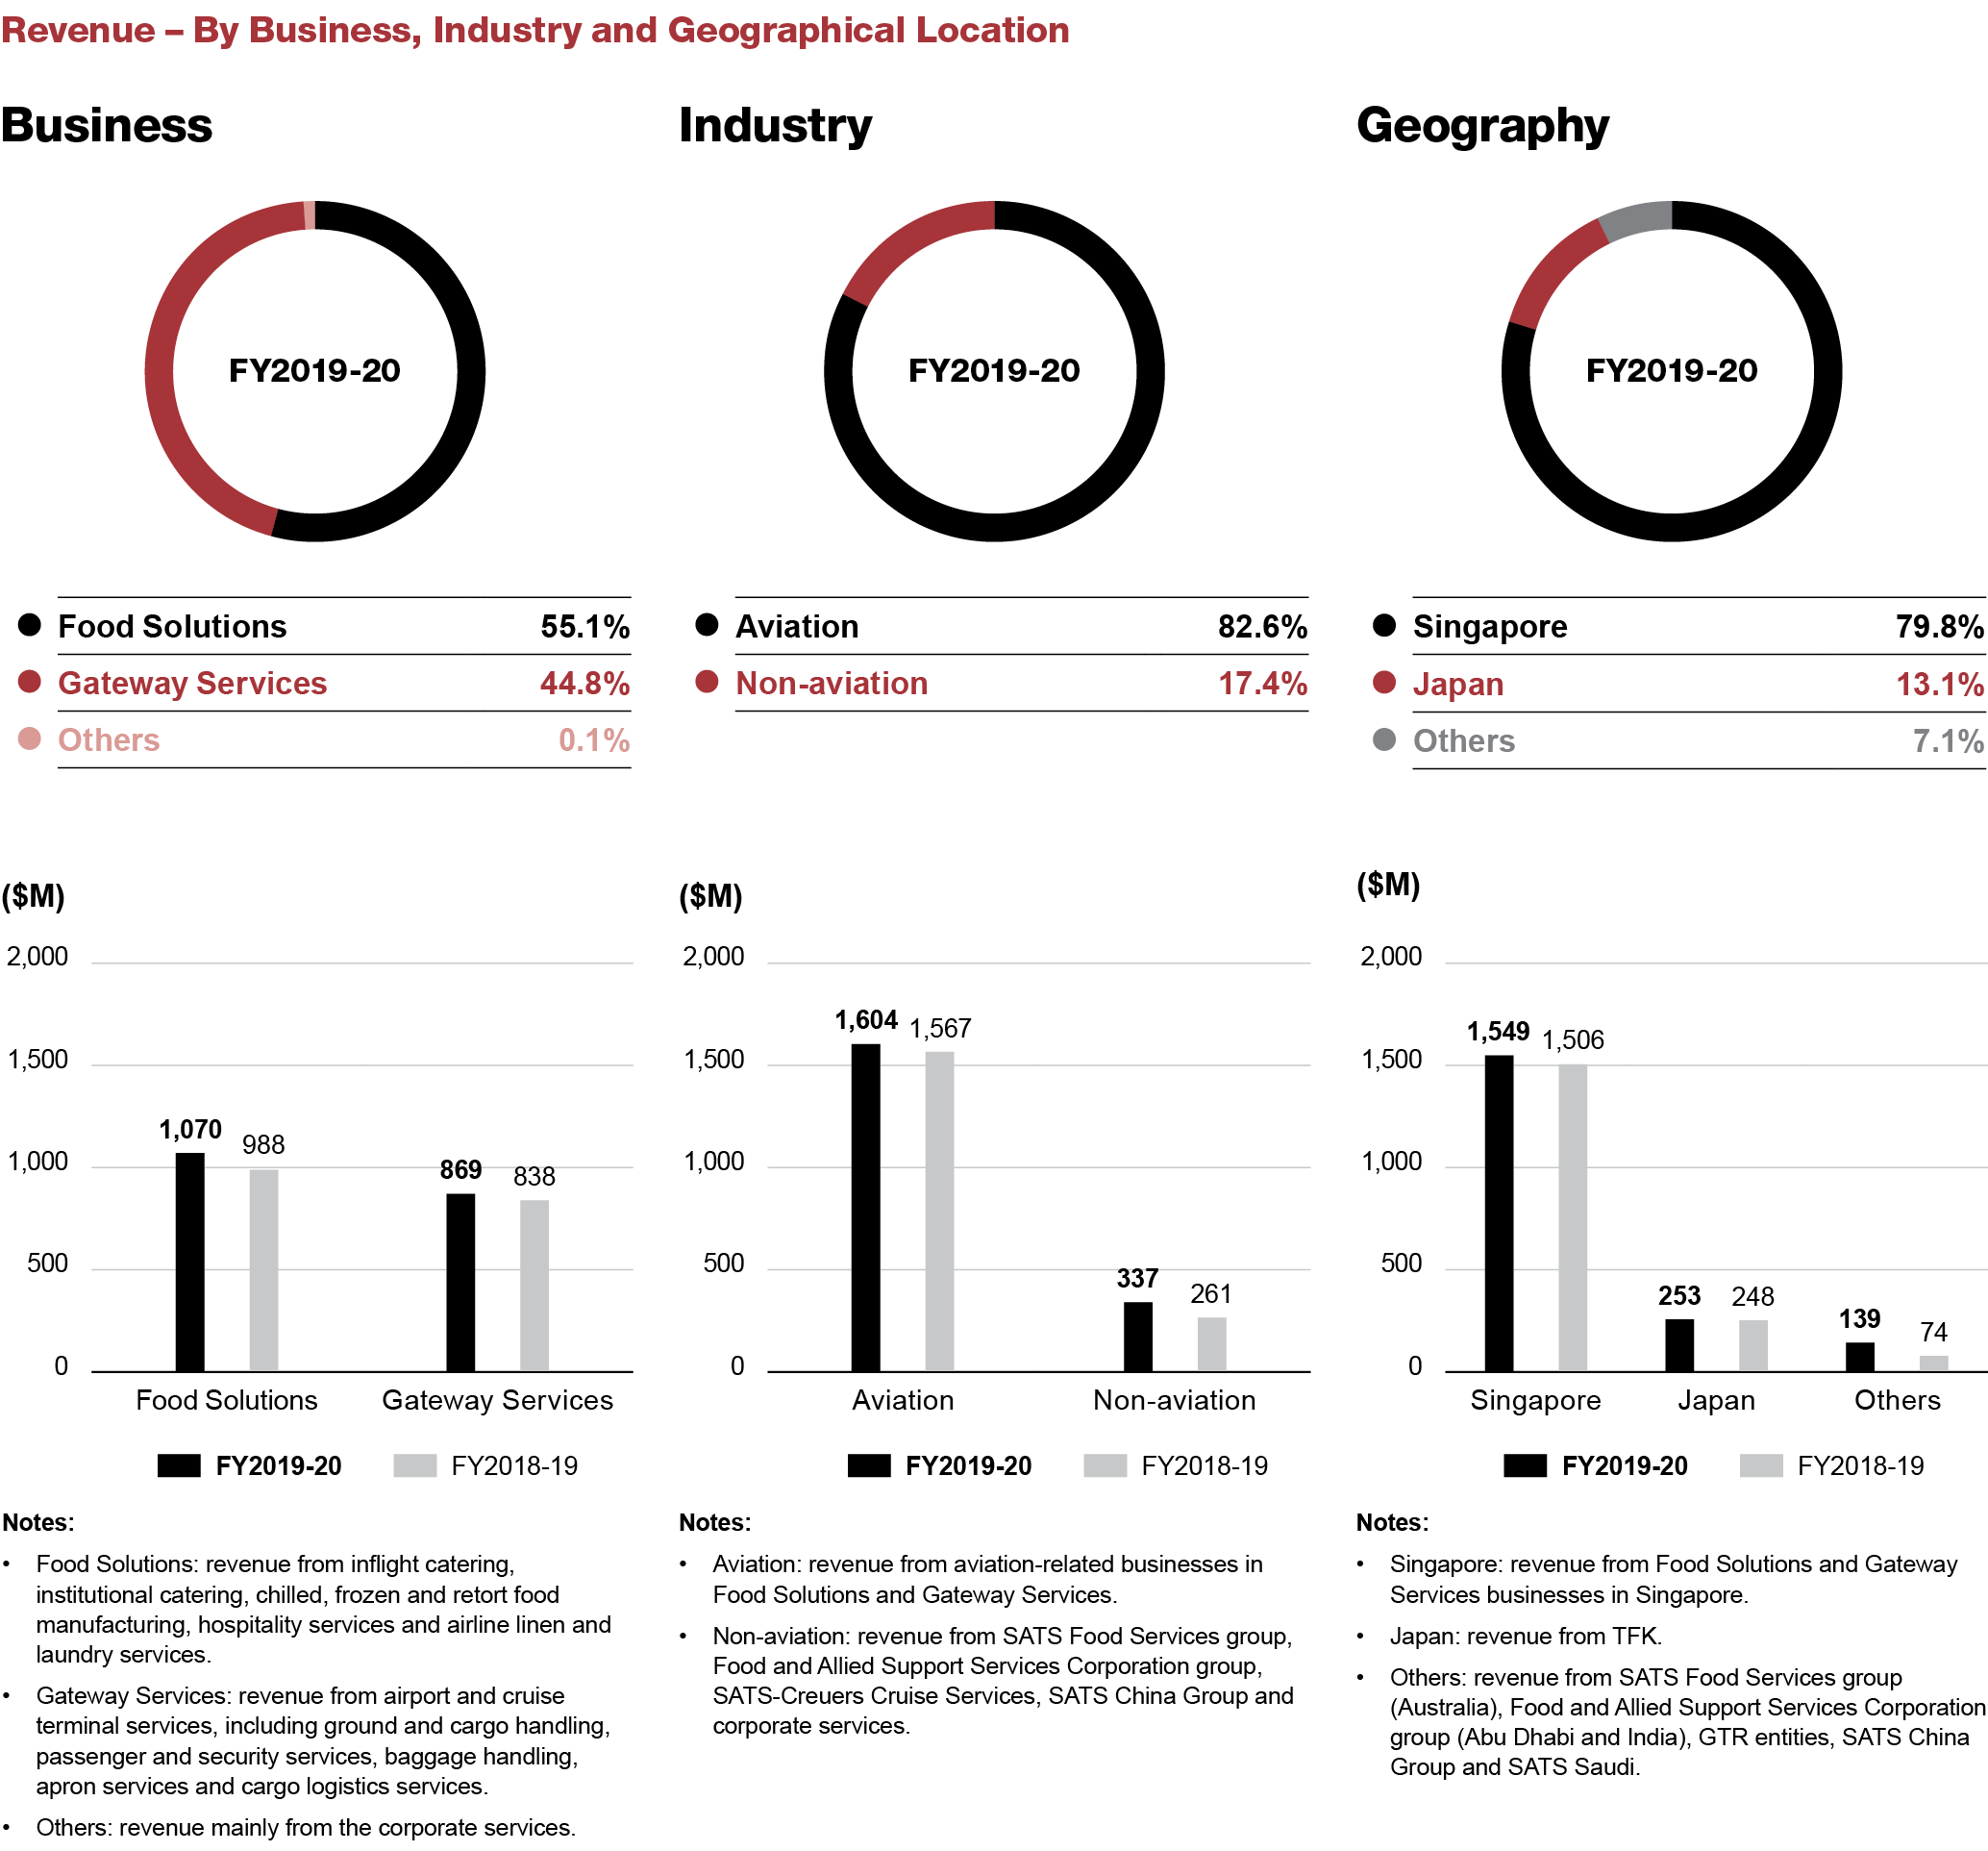
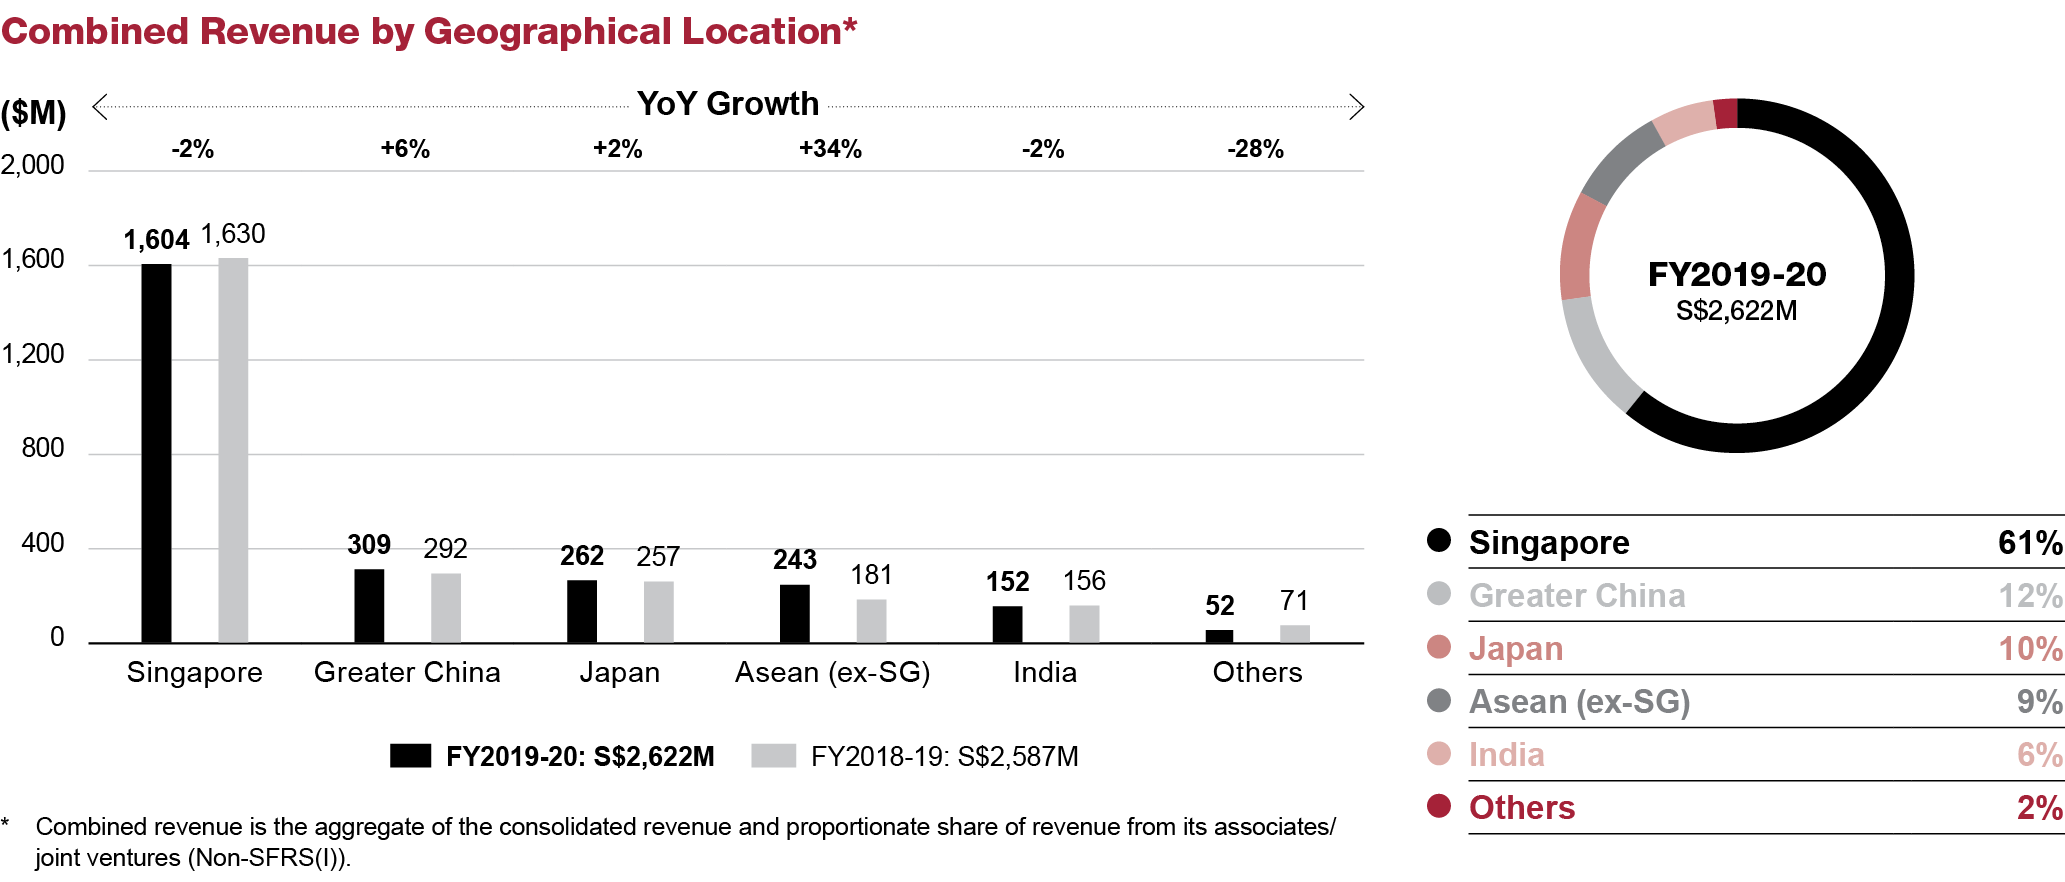
Amid a slowdown in the region due to US-China trade tension and the COVID-19 pandemic, Group revenue grew $113.2 million or 6.2% to $1,941.2 million for the year ended 31 March 2020. Food Solutions revenue was 8.3% higher attributed to the consolidation of CFPL and NWA, offset by the divestment of FASSCO in August 2019 and the lower aviation volumes in the last quarter of the financial year. Gateway Services revenue grew 3.7% driven by the consolidation of GTR and strong performance in ground handling pre-COVID period.
Despite higher revenue, operating profit declined by $20.8 million or 8.4% to $226.2 million as the global headwinds took a heavy toll on our financial performance. Operating profit margin was 11.7% compared to 13.5% from prior year.
Profit contribution from associates/joint ventures decreased $47.1 million or 80% to $11.8 million, compared to last financial year. This was due to lower business volumes experienced by almost all associates and joint ventures in the last quarter as
well as impairments made by the associates/joint ventures in terms of credit losses and asset impairments in view of the COVID-19 impact.
Other non-operating expenses increased $18.9 million mainly relates to impairments made for certain property, plant and equipment as well as investment in some associates due to COVID-19.
Group profit attributable to owners of the Company declined $80 million or 32.2% to $168.4 million. Excluding one-off items, the underlying net profit decreased $61.1 million or 25.3% year-on-year to $180.3 million.
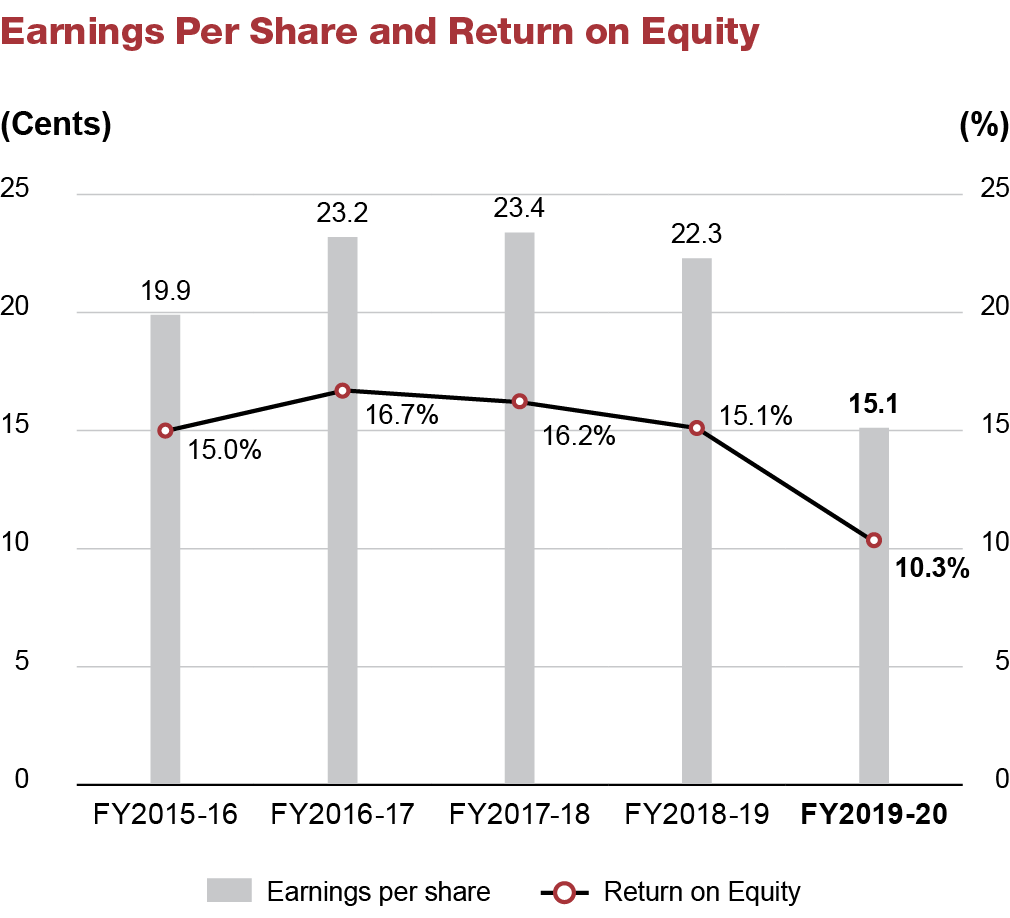
The Group’s return on equity declined 4.8 points to 10.3% over the year due to lower reporting earnings for the year.
As at 31 March 2020, total assets held in the balance sheet was $3,009.8 million with aggregate cash and short term deposits of $549.2 million, while free cash flow generated during the year amounted to $168.3 million. Debt-to-equity ratio was 0.39 times compared to 0.06 times a year ago.
Earnings Per Share
The Group’s earnings per share dropped 32.3% year-on-year to 15.1 cents compared to 22.3 cents due to lower reported earnings.
Dividends
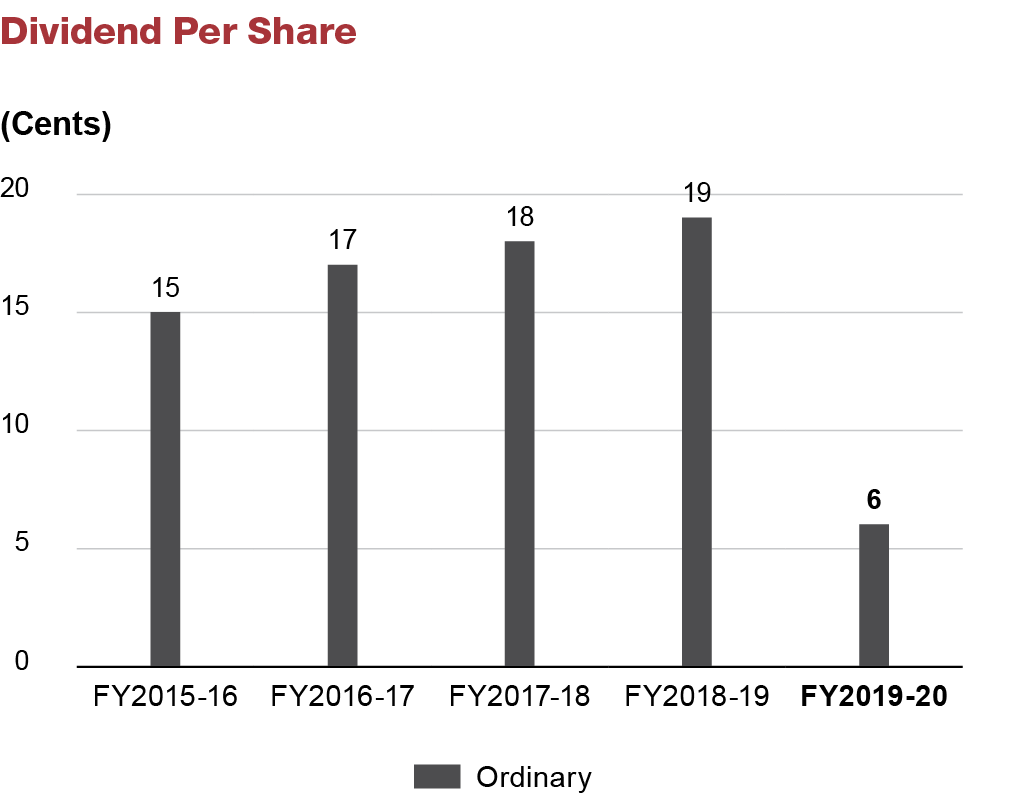
In light of the significant uncertainties in our operating environment, the Board of Directors believe that it would be prudent not to pay a final dividend for FY2019-20. Therefore, the total dividend paid for the full year FY2019-20 is 6 cents per share or $67.1 million in aggregate, which translates to a payout ratio of 39.8% to our shareholders.
Expenditure
The Group’s operating expenditure in FY2019-20 was $1,715 million, an increase of $134 million or 8.5% year-on-year primarily due to the consolidation of newly acquired subsidiaries, CFPL and NWA, offset by the divestment of FASSCO. This has led to an increase in both staff costs and cost of raw materials. The higher staff costs was mitigated by various government reliefs, lower contract services, overtime and other variable staff costs attributable to the lower aviation volume in the last quarter. Depreciation and amortisation was higher due to new projects and assets, partly offset by lower company premise and utilities expenses. Other costs increased due to higher maintenance expenses for ground support equipment, IT expenses to support digitalisation and transformation projects, fuel costs, lower foreign exchange gains as well as higher allowance for doubtful debts.

Financial Position
Total equity attributable to the owners of the Company decreased $31.7 million to $1,617.5 million as at 31 March 2020 primarily due to lower profits generated during the year after netting off dividend payment to shareholders, mitigated by lower treasury shares.
Total assets increased $601.4 million to $3,009.8 million, largely due to higher property, plant and equipment, intangible assets, long term investments, higher trade and other receivables, inventories as well as cash and short-term deposits.
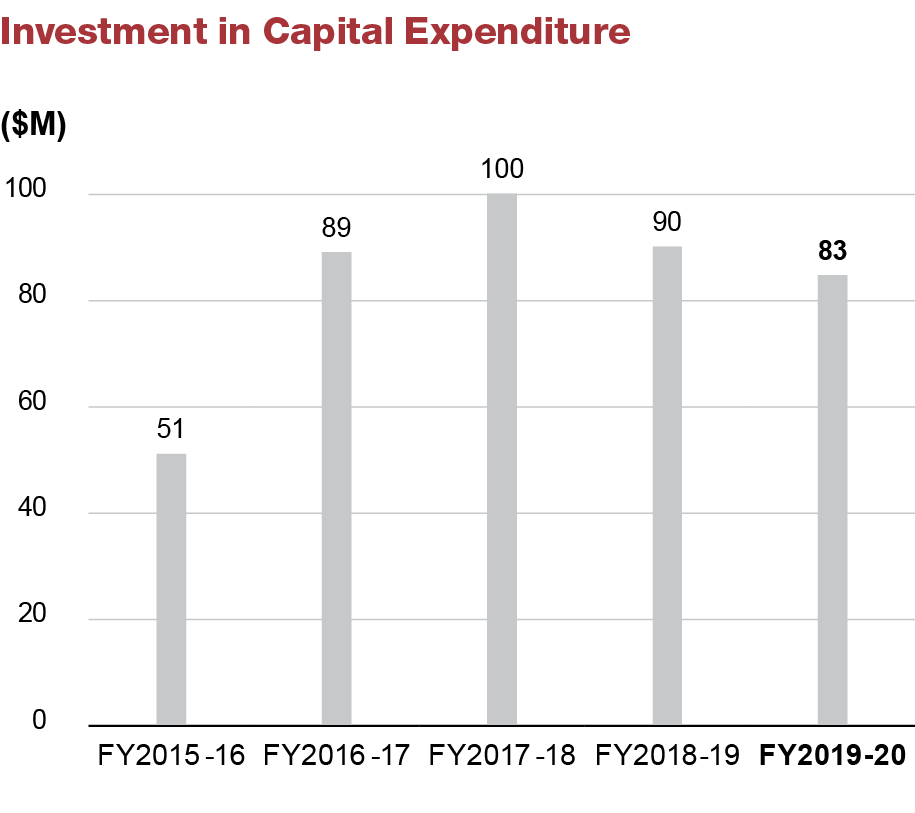
Capital expenditure of $82.8 million was $7.7 million, or 8.5% lower compared to last year. The Group’s net asset value per share as at end of current financial year was $1.45, 2.2% lower compared to last year.
The Group’s cash and cash equivalents was $549.2 million as at 31 March 2020, an increase of $199.3 million due to issuance of Series 001 Notes pursuant to the Multicurrency Debt Issuance Programme, drawn down of loan facilities, higher cash from operating activities as well as dividends received from associates/joint ventures.
Net cash from operating activities was $243.9 million, $51.8 million lower than the last corresponding period mainly due to lower operating profit and movement in working capital.
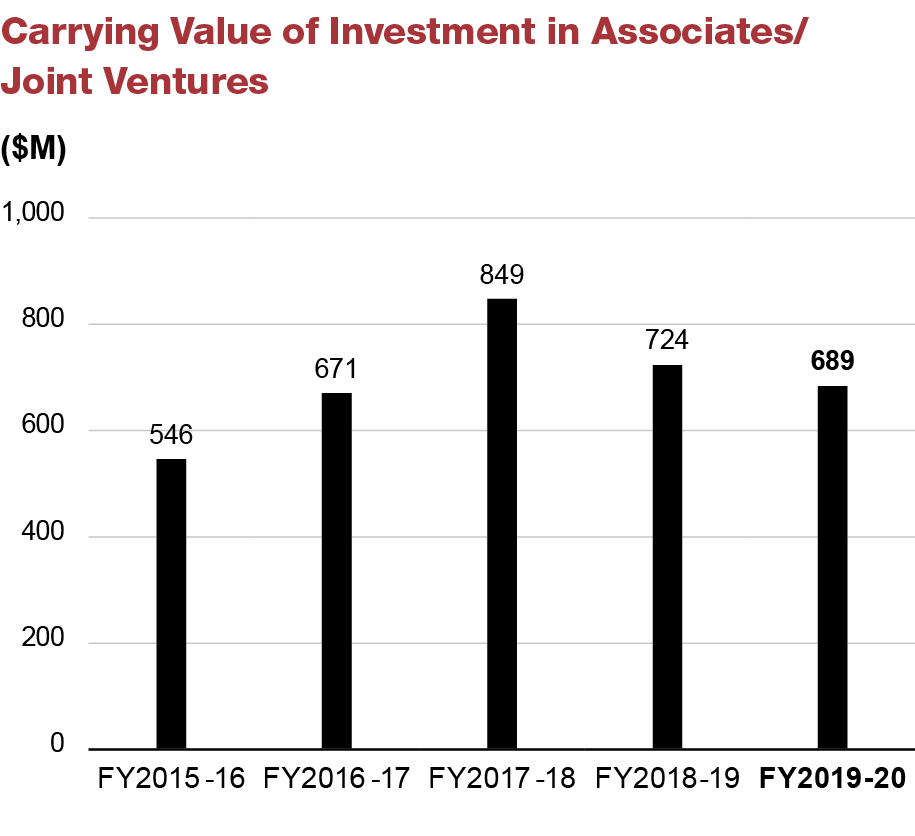
Net cash used in investing activities was $117.3 million, $45 million higher than the last corresponding period mainly attributable to the investment of $7 million in CFPL, net of $10 million cash balance in CFPL at acquisition, $24.1 million in NWA net of $6.1 million cash balance at acquisition and the latest acquired in 4Q FY2019-20, $21.8 million in MBUK net of $8.8 million cash balance at acquisition.
Net cash from financing activities was $66.5 million, $311.4 million higher compared to $244.9 million used in financing activities in the last financial year mainly due to issuance of notes and drawdown of loans, which partly offset by higher dividend paid to shareholders.
Free cash flow generated for the year was $168.3 million, a drop of $39.7 million as compared to prior year.
Value Added
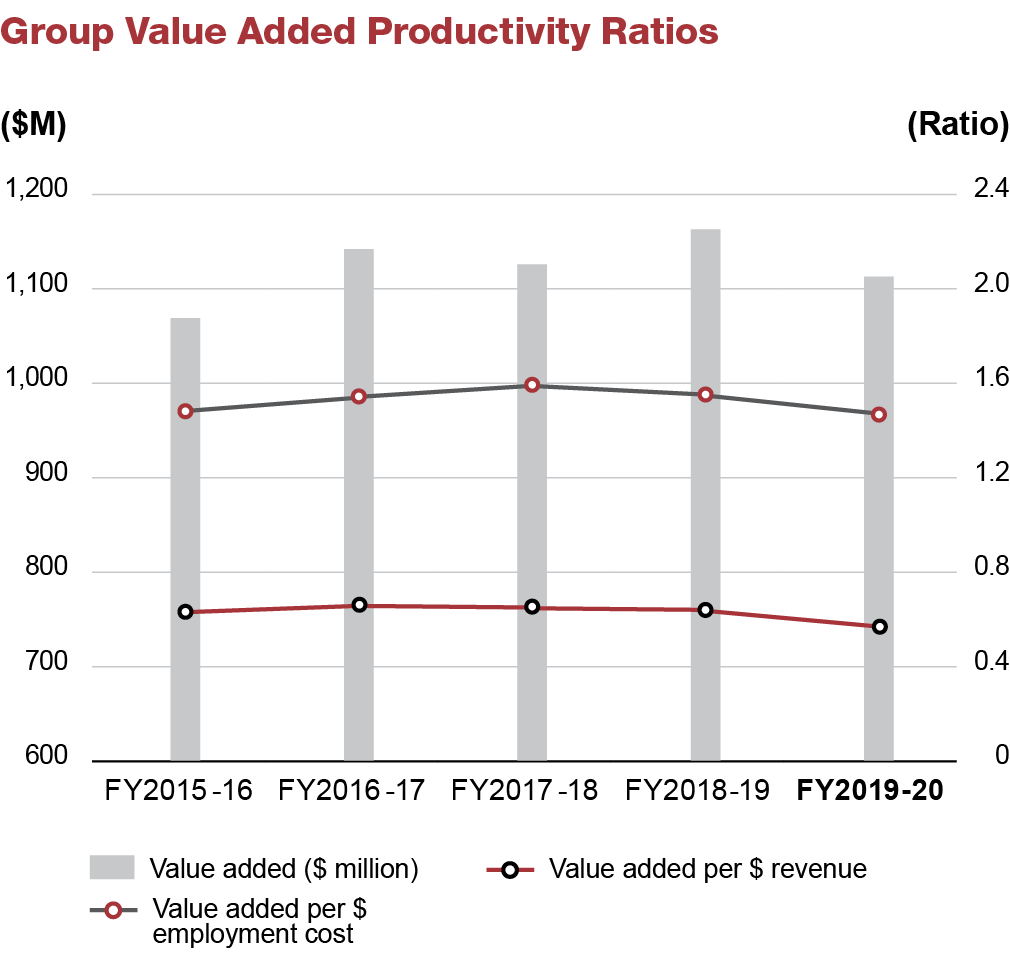
The value added of the Group was $1,113.1 million, a decrease of $50.2 million or 4.3% compared to the preceding financial year. The distribution for FY2019-20 is reflected in the chart below.
Staff Strength and Productivity
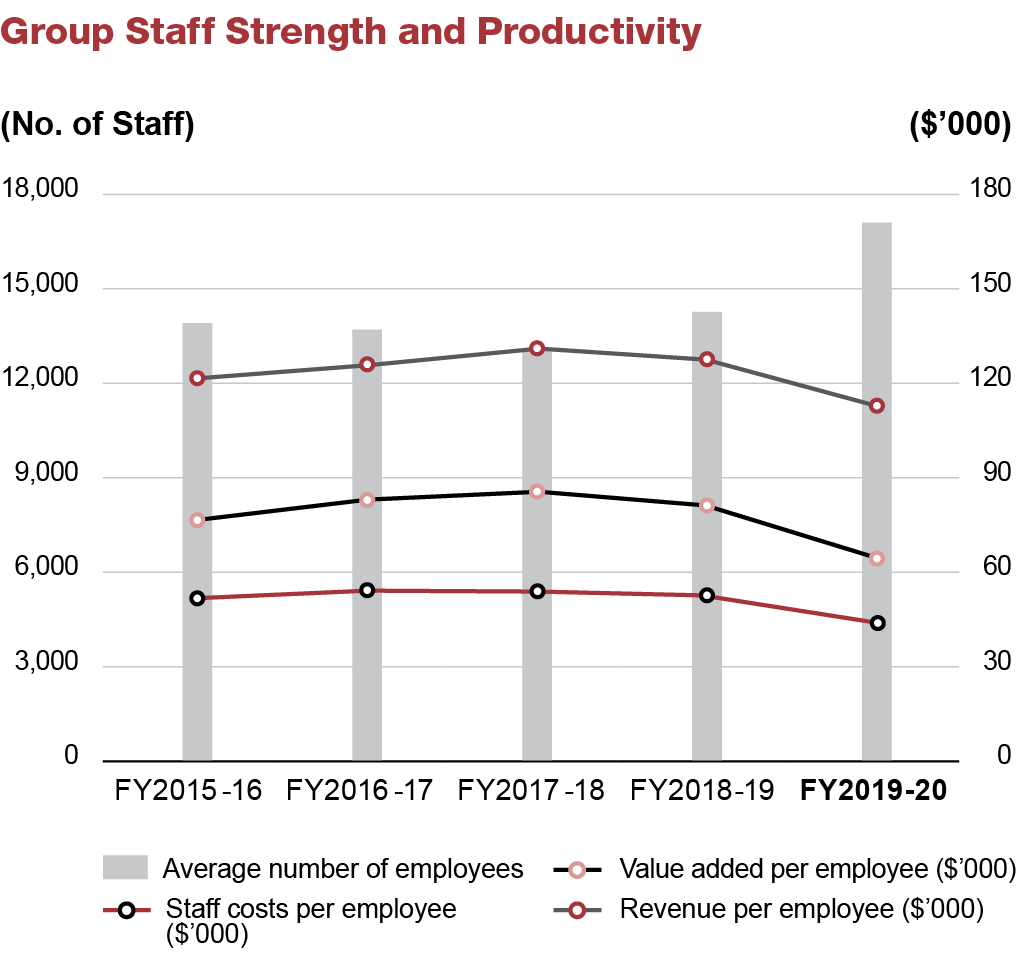
The average number of full-time equivalent employees in the Group for current financial year was 17,155. The 19.9% increase in headcount was mainly due to the consolidation of the newly acquired subsidiaries.
The breakdown of the average number of employees is set out as follows:
Staff productivity achieved during the year, measured by value added per employment cost, decreased 5.2% from 1.55 times to 1.47 times mainly due to expansion in staff strength and manpower costs pre-COVID period.

Economic Value Added (EVA)
EVA for the Group was $72.7 million, a drop of $38.4 million or 34.6% over the preceding financial year attributed to lower net operating profit after tax (NOPAT).
