Financial Review
Download Financial Review (387KB).
Highlights
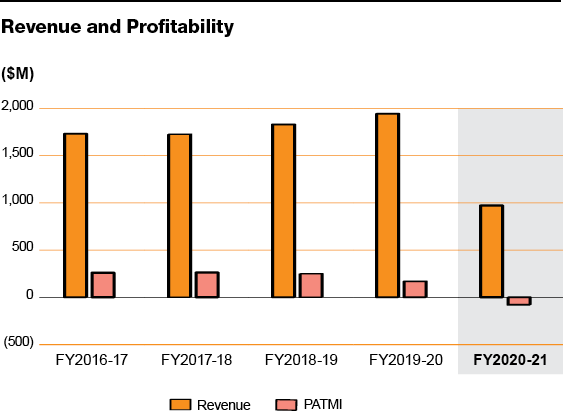
The COVID-19 pandemic has adversely affected the Group's businesses in a material way as airlines suffered a sharp decline in air travel demand following widespread travel bans and restrictions. Consequently, Group revenue for the year declined $971.2 million or 50% to $970 million. With the significant drop in aviation volumes, revenue from Food Solutions decreased $496.7 million or 46.4% to $573.8 million while Gateway Services’ revenue decreased $479.1 million or 55.1% to $389.7 million. This was mitigated by revenue from newly consolidated entities, namely Country Foods Pte. Ltd. (“CFPL”), Nanjing Weizhou Airline Food Corp., Ltd. (“NWA”) and Monty’s Bakehouse UK Limited (“MBUK”), amounting to $118.9 million.
Despite comprehensive cost controls and large scale redeployment of staff, operating profit for the Group decreased $236.3 million or 104.5% to an operating loss of $10.1 million, compared with an operating profit of $226.2 million in the last financial year.
Profit contribution from associates/joint ventures was similarly impacted by the pandemic, decreasing $59.8 million from a profit of $11.8 million to a loss of $48 million.
Other non-operating loss increased $51.3 million attributed mainly due to impairments made for investment in associates, long-term investment, intangible assets and property, plant and equipment due to the COVID-19 pandemic. This was partly offset by the write back of deferred consideration of $13.7 million.
Group net (loss)/profit attributable to owners of the Company (“PATMI”) fell $247.3 million or 146.9% to net loss of $78.9 million year-on-year. Excluding one-off items, core PATMI was reduced to net loss of $23.9 million.
Without government reliefs, Group PATMI would have been a net loss of $320.8 million.
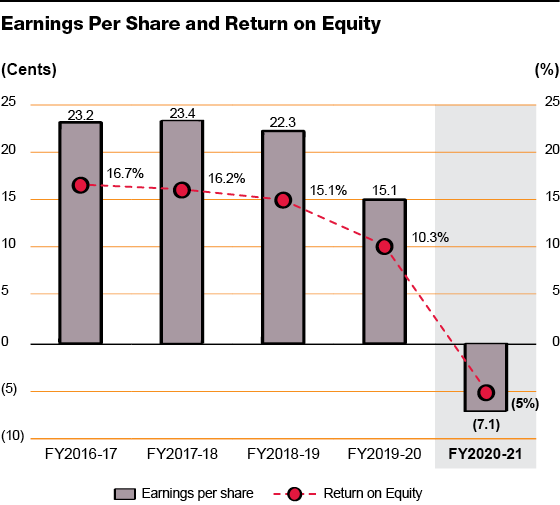
Return on equity dipped to negative 5.0%, 15.3 points lower than the year before attributed to losses recorded for the year.
As at 31 March 2021, the Group’s total assets were $3,091.8 million with aggregate cash and short-term deposits of $879.8 million, while free cash flow generated
during the year amounted to $56.2 million. Debt-to-equity ratio
was 0.56 times compared to 0.39 times a year ago.
Earnings Per Share
The Group’s earnings per share dropped 147% year-on-year to negative 7.1 cents compared to 15.1 cents due to the net loss reported for the year.
Dividends
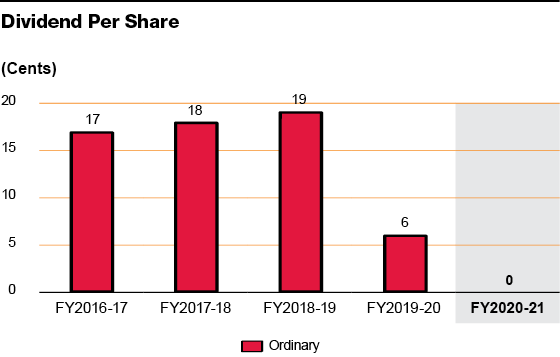
In light of the significant uncertainties in the operating environment, the Board of Directors believes that it would be prudent not to pay dividend for FY2020-21.
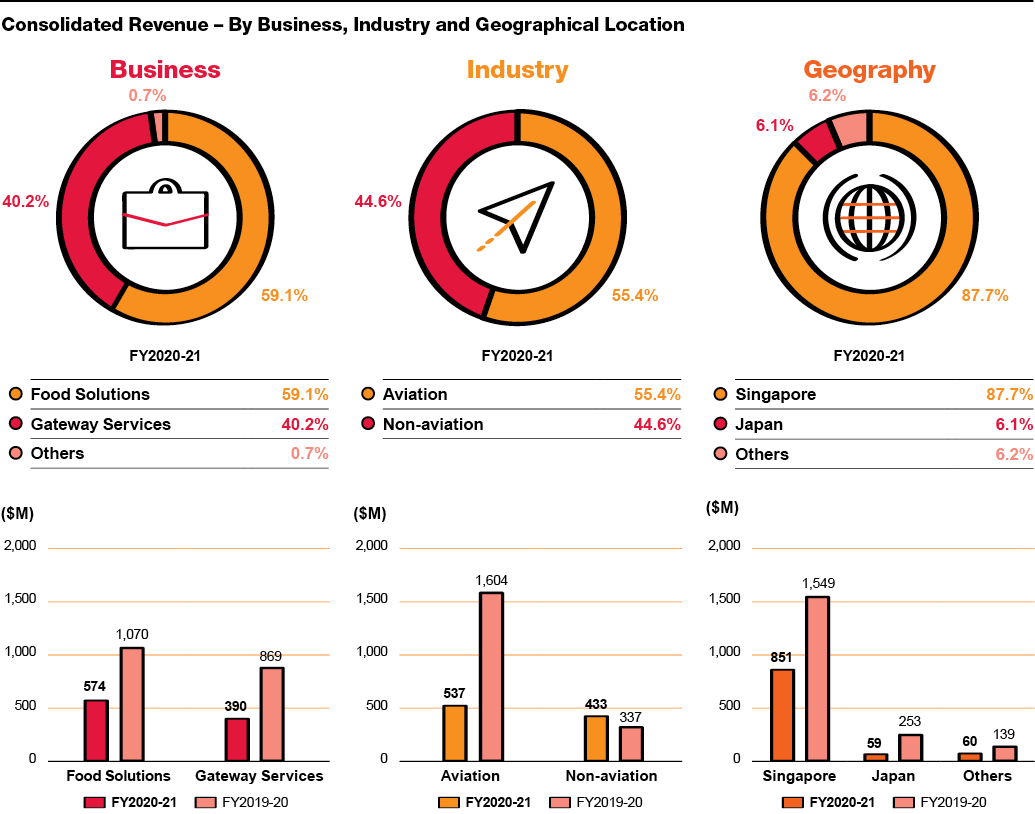
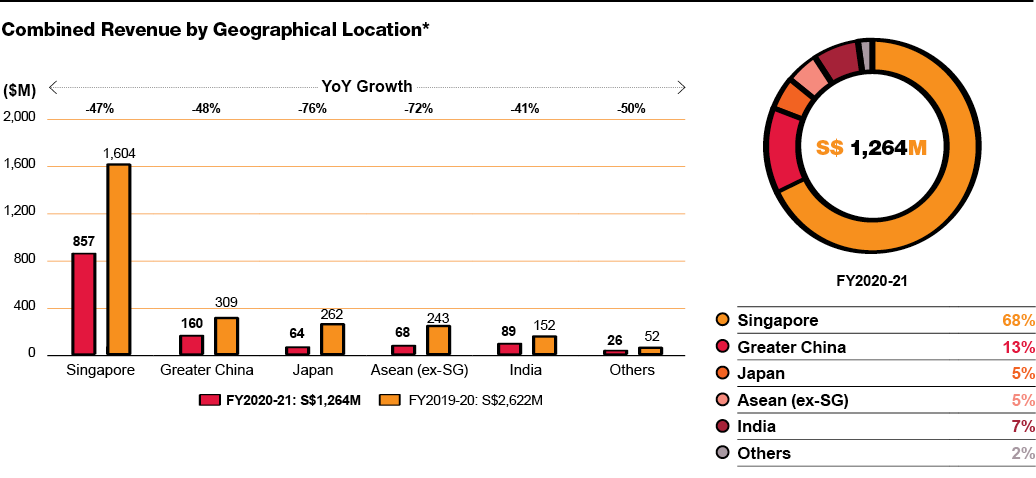
The Group’s combined revenue fell sharply by 51.8% year-on-year with overseas contribution dropped from 39% to 32%.
Expenditure
The Group’s operating expenditure was lower by $734.9 million or 42.9% year-on-year at $980.1 million after accounting for government reliefs, lower aviation volumes as well as comprehensive actions taken to reshape the cost base of the Group. Staff costs decreased $497.2 million due to lower salary related costs from reduced workforce, lower contract services as well as government reliefs. The reduction in cost of raw materials was due to the decrease in aviation volume, partly offset by the consolidation of CFPL, MBUK and NWA. Licence fees dropped $64.6 million in tandem with the lower aviation revenue recorded for the year. Depreciation and amortisation rose $12.8 million mainly due to new investments and systems acquired last year. Group-wide cost containment measures have resulted in a decrease in company premises and utilities expenses. Other costs were also lower, partly offset by the higher provision for doubtful debts of $9.7 million made in the financial year.

Financial Position
Total equity attributable to the owners of the Company decreased 4.4% to $1,546.3 million as at 31 March 2021. Total equity reduced by $106.7 million largely attributed to the loss after tax for the financial year of $109.3 million.
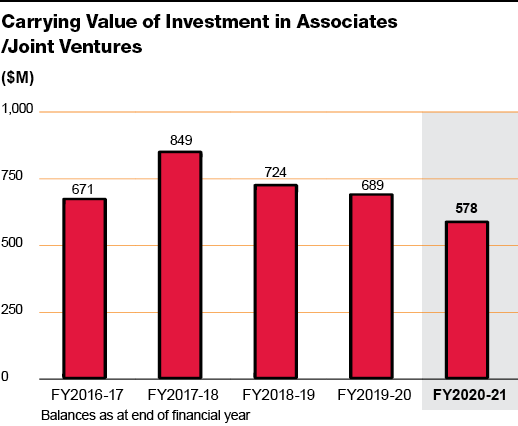
Total assets increased $81.3 million to $3,091.8 million, primarily due to higher cash and cash equivalents and inventories, partly offset by lower property, plant and equipment, investment in associates, joint ventures and long-term investments. Property, plant and equipment was lower mainly due to depreciation and impairment made in the year. The lower investment in associates and joint ventures was mainly due to lower share of results from associates/joint ventures and impairments recorded. A total impairment charge of $92.8 million was made to property, plant and equipment, investment in associates and long-term investment in the current year.
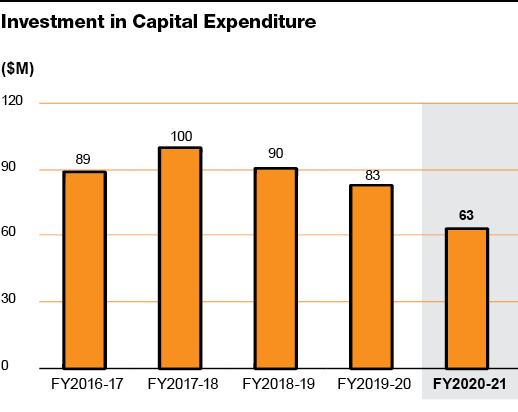
Capital expenditure of $62.6 million was $20.2 million, or 24.4% lower compared to last year while the Group’s net asset value per share as at end of current financial year was $1.38, 4.6% lower compared to last year.
The Group’s cash and cash equivalents was $879.8 million as at 31 March 2021, mainly attributed to drawdown of credit facilities and lower investing activities.
Net cash from operating activities was $117.8 million, $126.2 million lower than the last corresponding period mainly due to operating loss in FY2020-21.
Net cash used in investing activities decreased $88.9 million to $28.4 million mainly due to the absence of investment in subsidiaries and and associates/joint ventures in the current financial year.
Net cash from financing activities was $239.5 million, $173 million higher compared to $66.5 million last year, largely due to further drawdown of credit facilities (including Notes) of $482.7 million in the current financial year. This was partly offset by the repayment of term loans of $209.1 million during the year.
Free cash flow generated for the year was $56.2 million, a drop of $112.1 million as compared to prior year.
Value Added
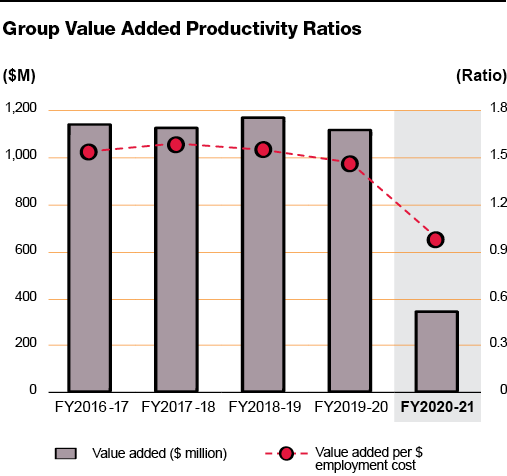
The value added of the Group was $350.9 million, a decrease of $762.2 million or 68.5% compared to the preceding financial
year. The distribution for FY2020-21 is reflected in the chart below.
Staff Strength and Productivity
The average number of full-time equivalent employees in the Group for current financial year was 12,977. The 24.4% decrease was due to cost management initiatives to navigate through the pandemic.
The breakdown of the average number of employees is set out as follows:

Staff productivity achieved during the year, measured by value added per employment cost, decreased 33% from 1.47 times to 0.99 times mainly due to lower revenue coupled with impairment losses during the year.

Economic Value Added (EVA)
EVA for the Group was negative $185.4 million, a drop of $258.1 million from the preceding financial year attributed to lower net
operating profit after tax (NOPAT).
